the project
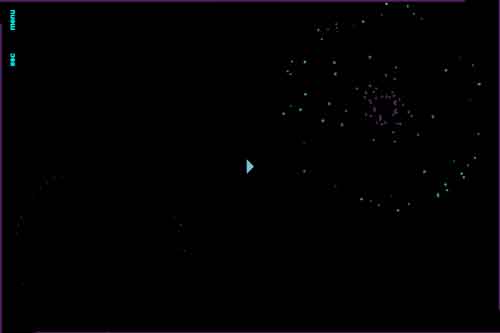
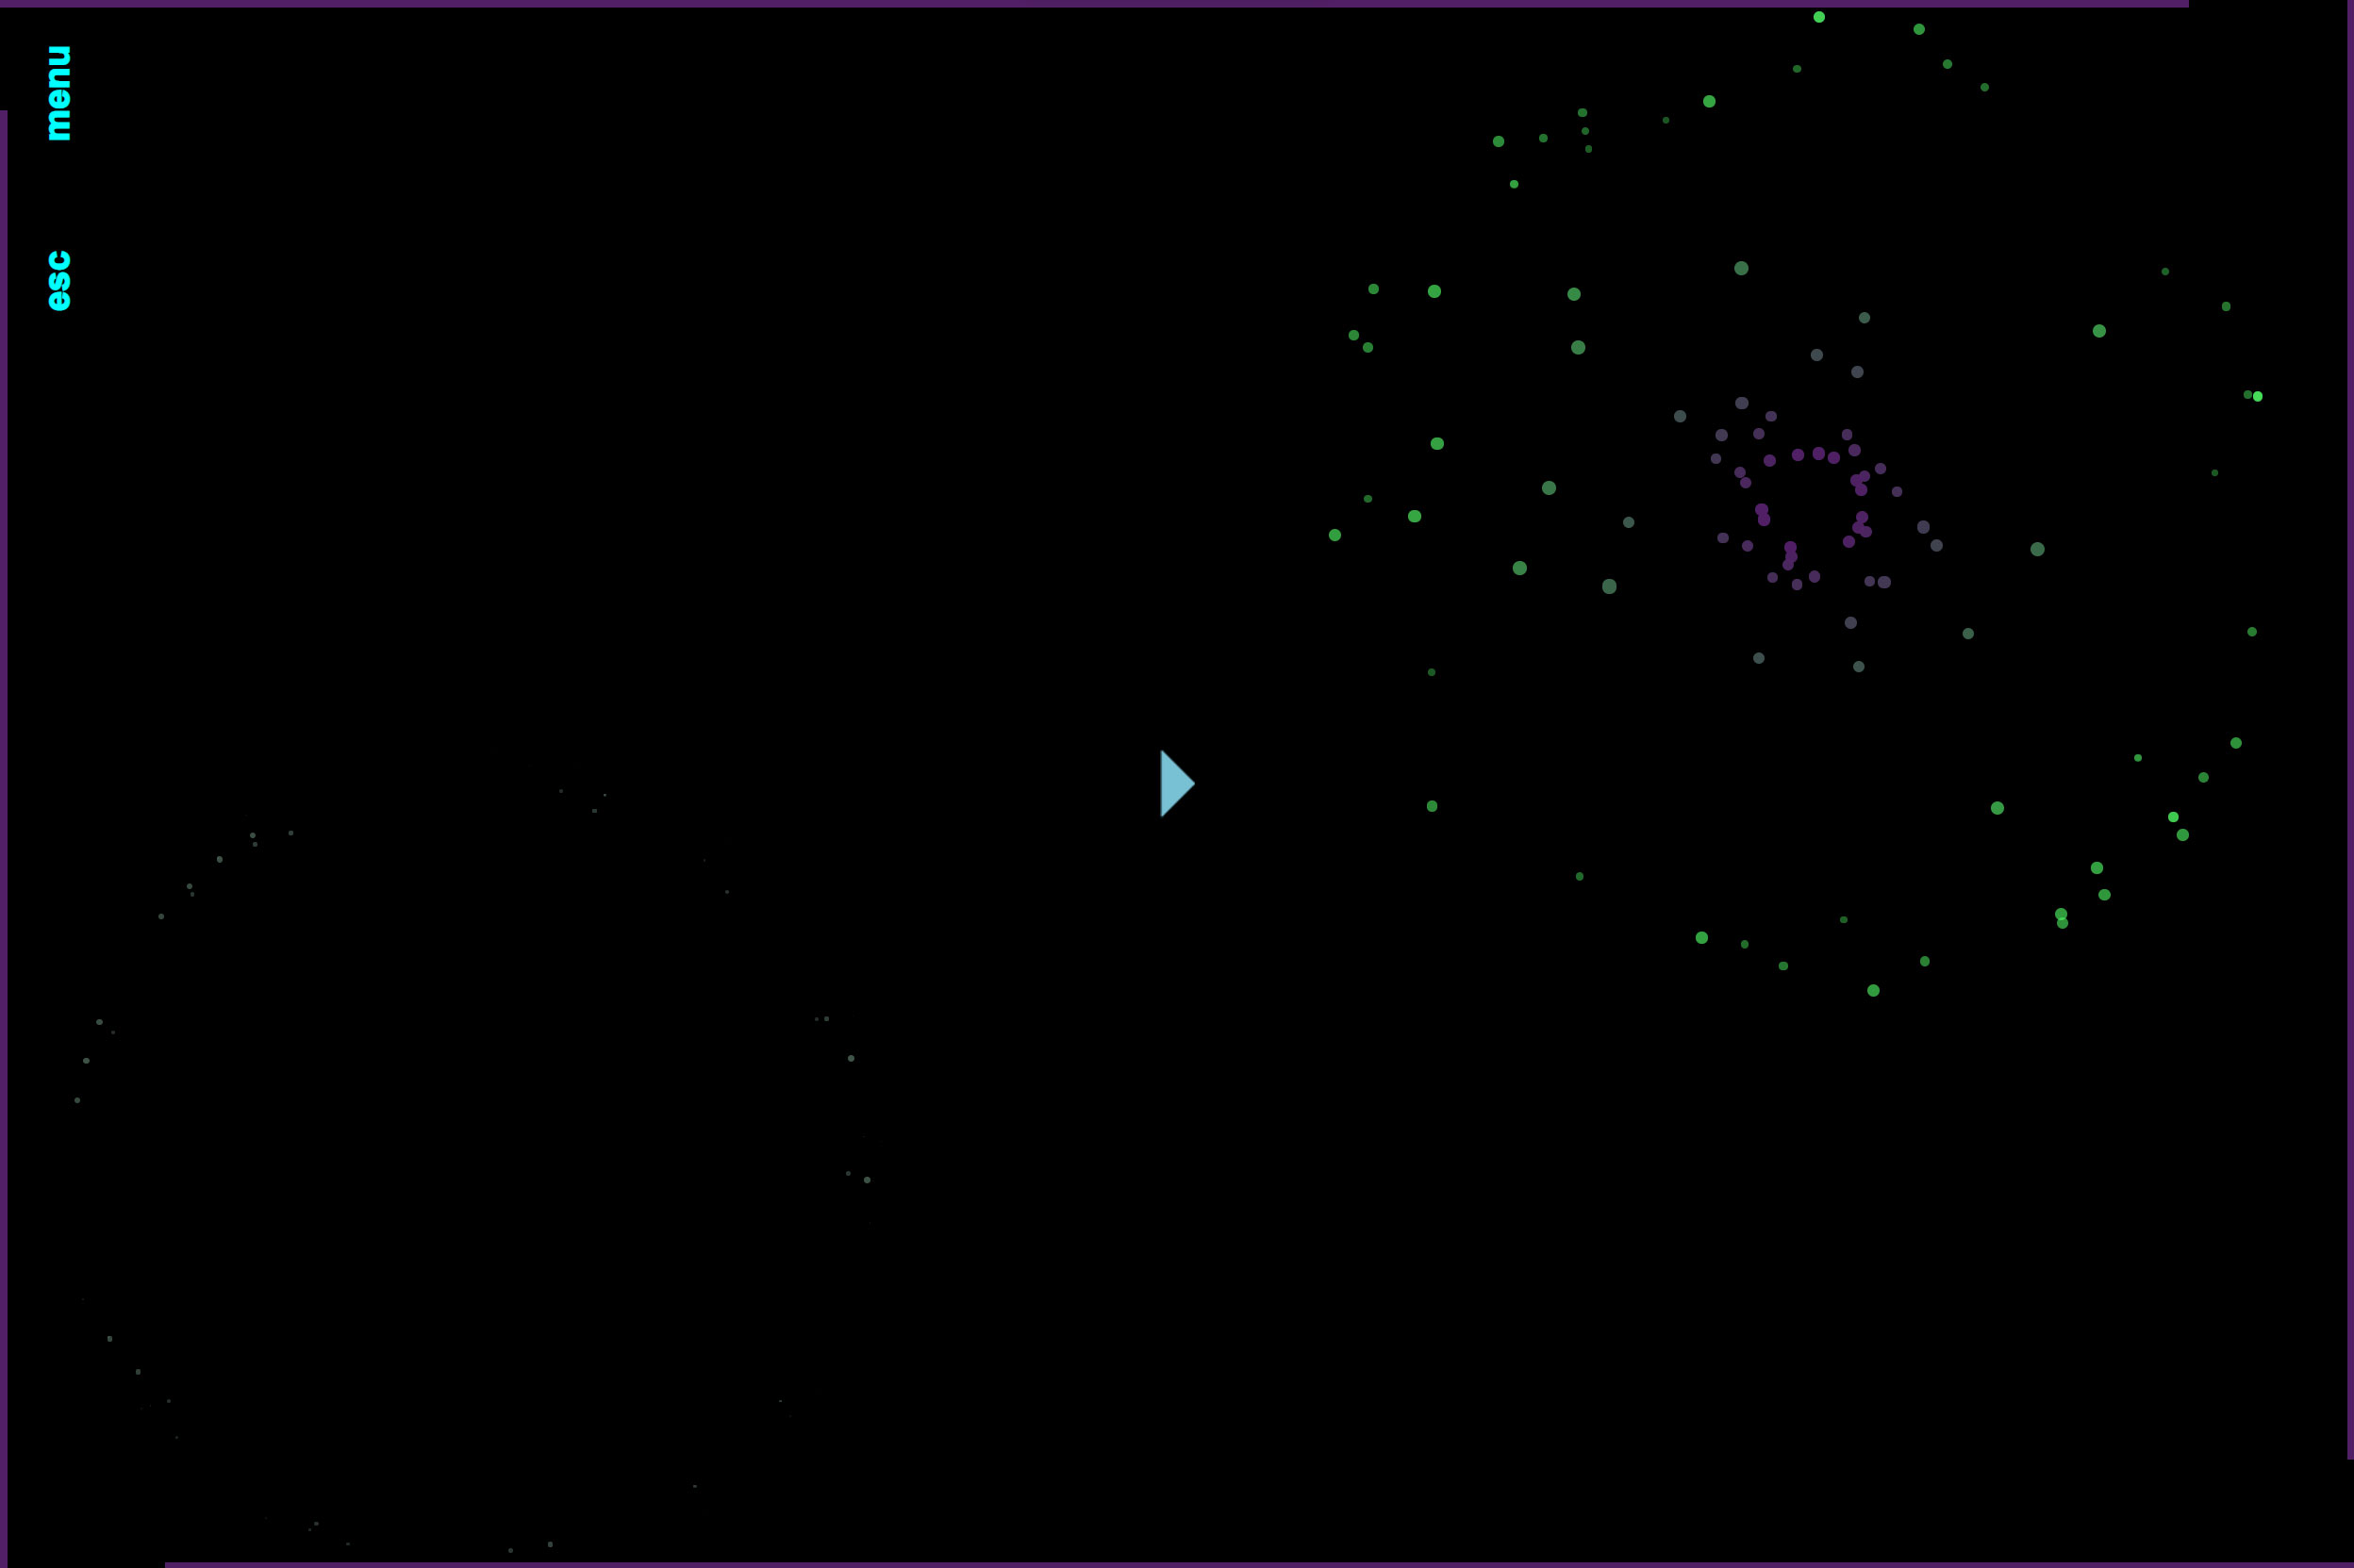
A tone is a wave, has an amplitude, has a frequency and is so calculable that it can be represented by a few dry numbers. If you give meaning to these numbers, you can visualize tones. Images are created that would otherwise only exist in the imagination (or in Windows Media Player).
Sound can be visualized in an infinite number of ways. One of these ways is shown in this interactive web page. Choose a piece by Chopin, the film music of "Also sprach Zarathustra" or upload your own mp3 file and set off your fireworks.
The visualization runs best in Chrome, Firefox, Brave or Opera web browsers. Not supported are iPads and smartphones.
the process
This project was created during a two-day hackathon. At that time I had very little experience in programming, especially JavaScript programming language was very unknown to me at that time. My only goal in this hackathon, to represent sound in some way visually.
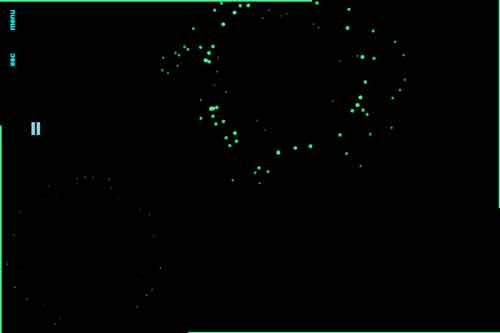
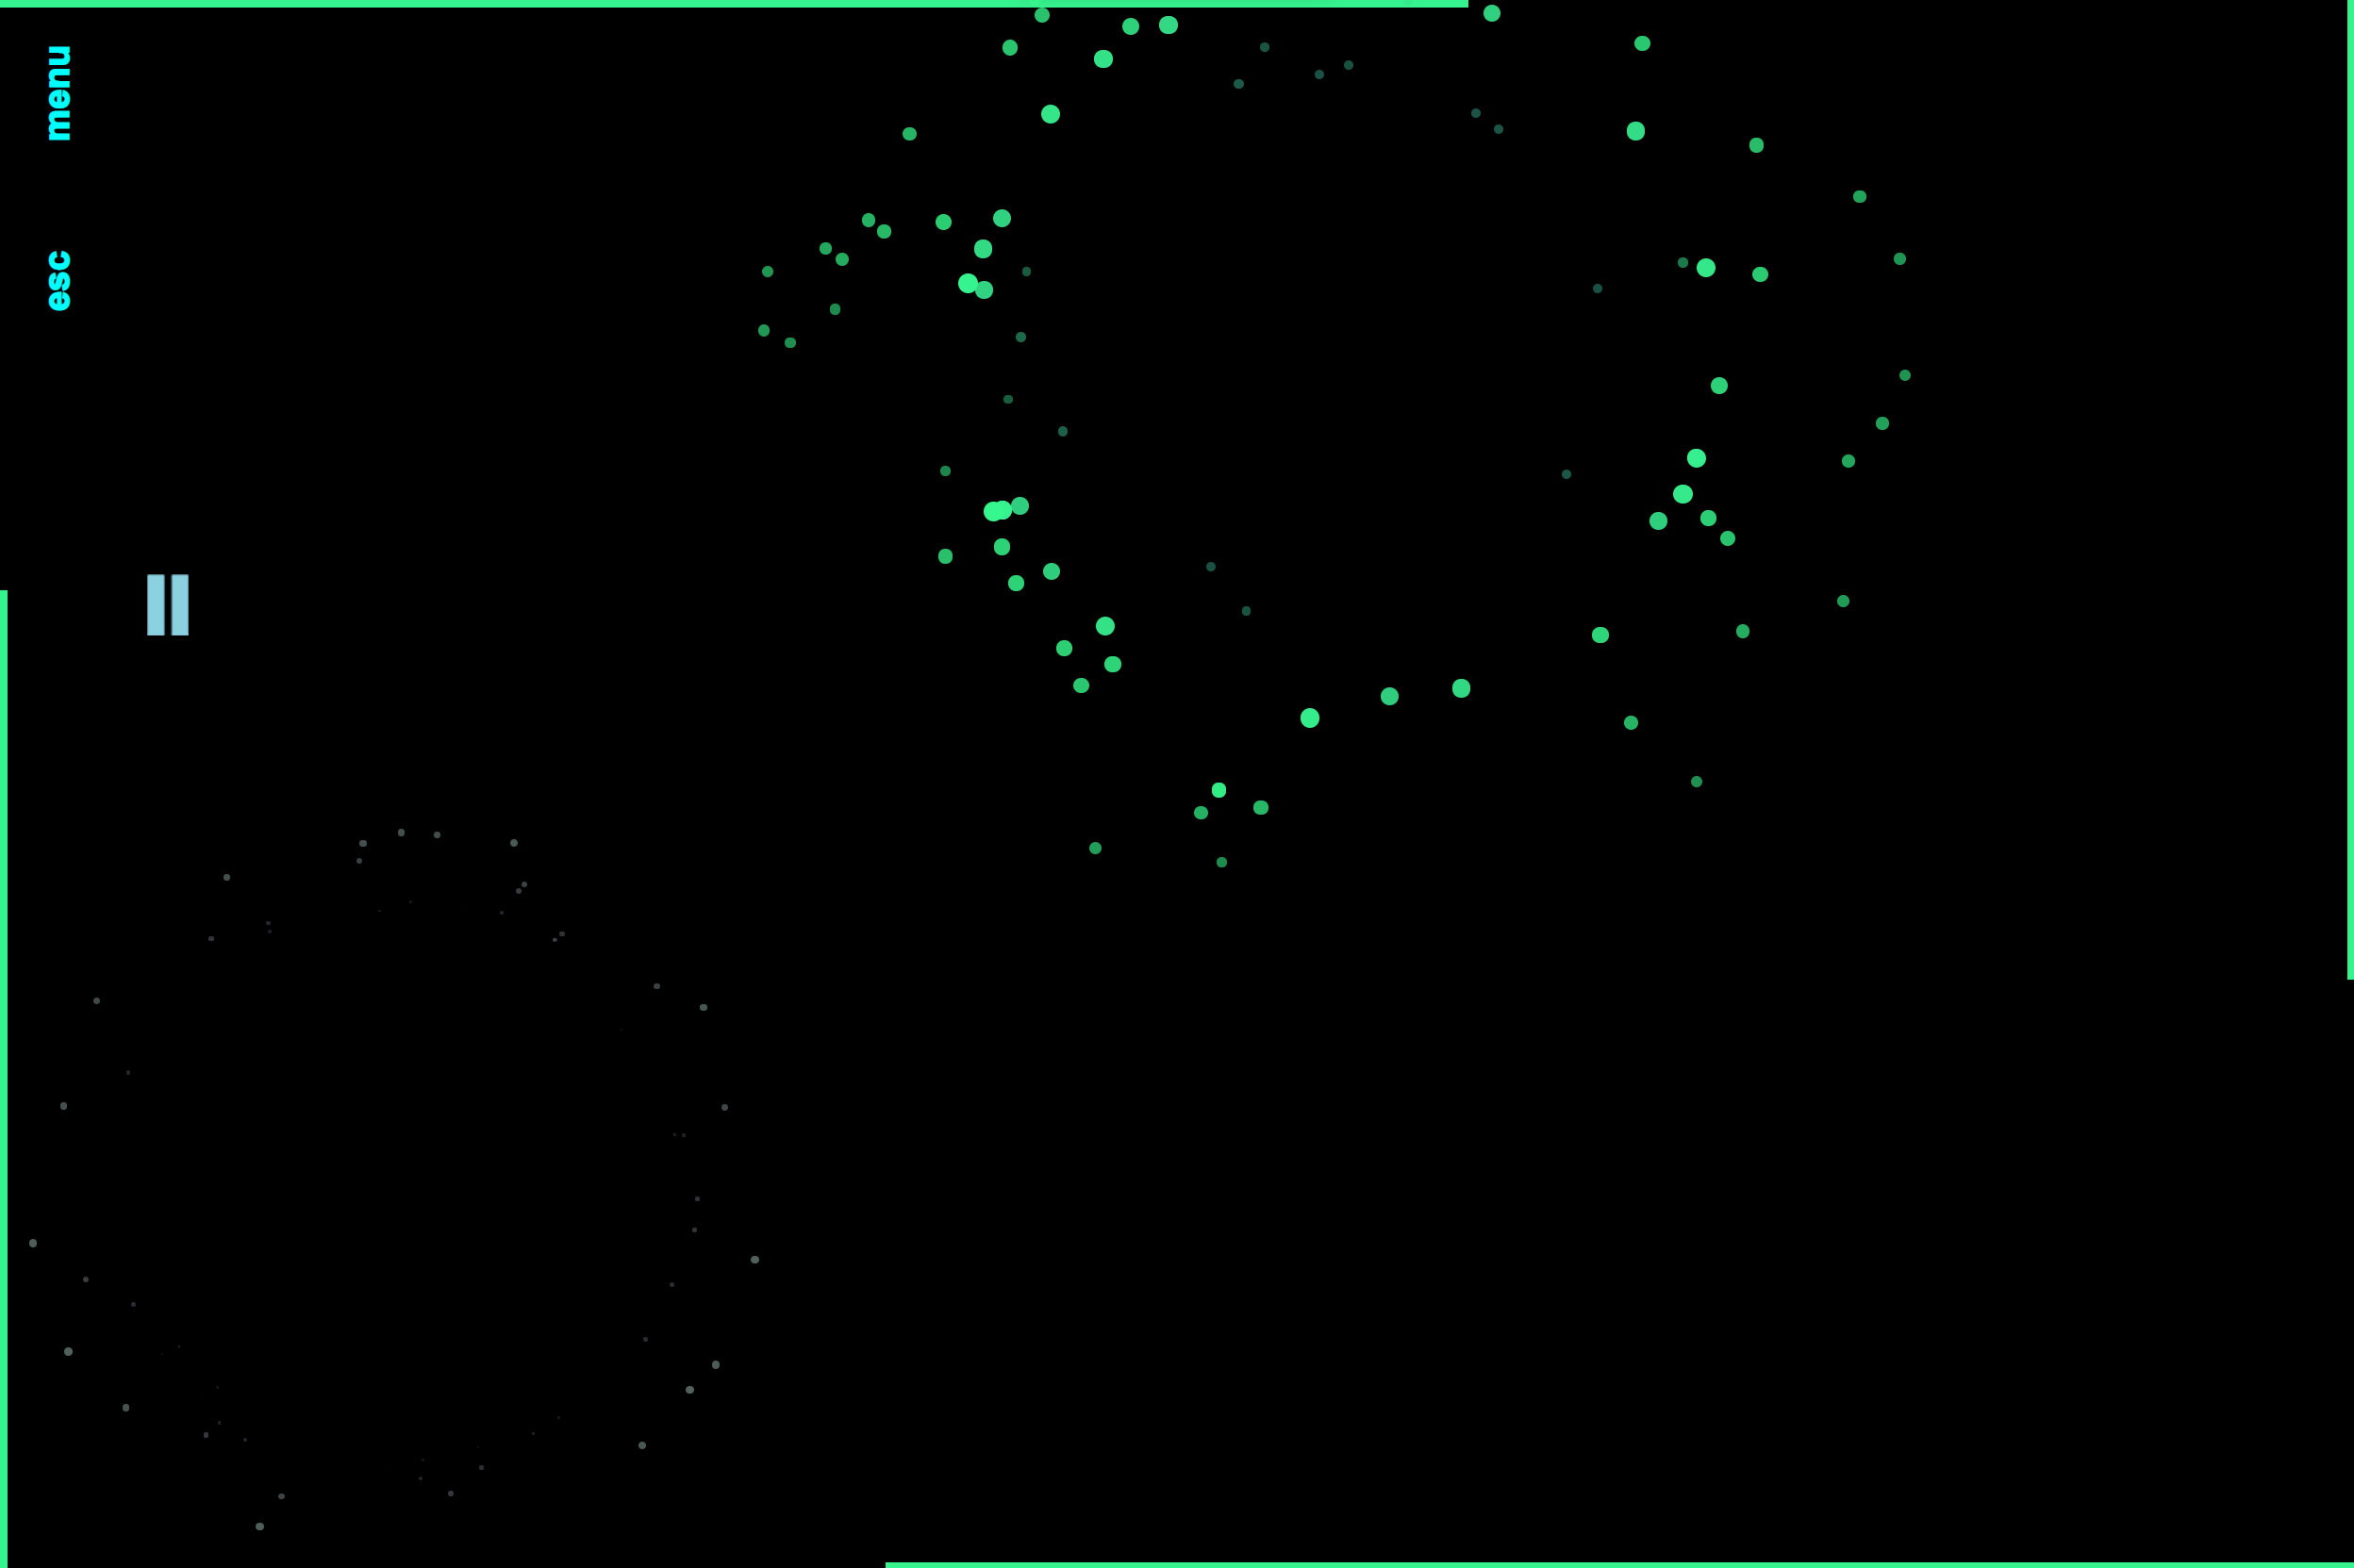
I worked with the Web Audio API from the beginning. The first thing I tried to do was to decode the output of this API. Gradually, I managed to create circular visualizations from this data.
Eventually, I got to the point where I had to include a player. I wanted to make the interface as simple and minimalistic as possible to give the visualization as much space as possible. I decided to include the progress of the song in the visualization as a bar on the edge of the viewport and to interpret pause and play as a click on the viewport.
Performance and usability played a very minor role in this project. This allowed me to experiment as much as possible.